I will be on the road for the next two days. Will be back to update the blog as usual on Wednesday.
Happy Thanksgiving, all!
Sunday, November 22, 2009
Wednesday, November 18, 2009
Updates on TRIT
Third Quarter 2009 Earnings Highlights
You may find related articles in
http://cocacolabuffet.blogspot.com/2009/10/no-drought-for-trit.html
http://cocacolabuffet.blogspot.com/search/label/Green%20Technology
Disclaimer: This blog is for general information purpose only. Stocks/financial instruments mentioned in this blog are not to be taken as investment advice/recommendation. Readers must consult their own financial advisors and/or consider their own risk/reward profile before making investment/trading decisions. The blog author is not liable for any investment/trading decisions of readers should readers decide to base the decisions on information provided by the blog.
Disclosure: The blog author owns TRIT in her personal account as of November 18,2009
- Revenue for Q3 2009 increased 131% to $4.9 million from $2.1 million in Q3 2008.
- Gross profit (exclusive of depreciation and amortization) increased 112% to $1.9 million for Q3 2009 from $0.9 million in Q3 2008.
- Q3 2009 gross margins decreased slightly at 39.1%, vs. 42.6% for Q3 2008.
- Income from operations increased 150% to $1.3 million from $536,000 in Q3 2008.
- Net income increased 112% to $1.1 million from $506,000 in Q3 2008.
- Diluted earnings per share increased to $0.27, from $0.14 in Q3 2008.
- Weighted average number of diluted shares outstanding was 3.95 million as of September 30, 2009, compared to 3.56 million as of September 30, 2008.
- Completed an initial public offering of 1,700,000 ordinary shares at a price of $6.75 per share, traded on NASDAQ Capital Market on September 10, 2009.
- Awarded $960,000 in Mountain Torrent Forecasting contracts covering eight projects in four provinces.
- Awarded $1.6 million Municipal Sewage Treatment contract in Kuancheng County of Hebei Province.
- Awarded $1M Phase One Contract for Wastewater Treatment Plant in Jinjing Newtown in Baodi District of Tianjin Municipality in Northern China.
You may find related articles in
http://cocacolabuffet.blogspot.com/2009/10/no-drought-for-trit.html
http://cocacolabuffet.blogspot.com/search/label/Green%20Technology
Disclaimer: This blog is for general information purpose only. Stocks/financial instruments mentioned in this blog are not to be taken as investment advice/recommendation. Readers must consult their own financial advisors and/or consider their own risk/reward profile before making investment/trading decisions. The blog author is not liable for any investment/trading decisions of readers should readers decide to base the decisions on information provided by the blog.
Disclosure: The blog author owns TRIT in her personal account as of November 18,2009
Tuesday, November 17, 2009
DDR's Deal Signals Recovery in Credit Market?
Commercial real estate industry has long been the alleged next leg down for the economy and financial markets. The industry not only has been plagued by defaults, declined occupancy and rent, but also the shut-down of credit market to finance property purchase and development. Since March, the credit market has been gradually easing, as shown by significant drops in credit spread. The recent success in U.S. mall owner Developers Diversified Realty Corp (DDR) in debuting the first Term Asset-Backed Securities (TALF) loan is a further evidence that commercial loan market is back to business. Under TALF, investors apply for low-cost non-recourse loans that are backed by the bond collateral. TALF has cut borrowing costs for consumer auto loans and credit cards.
According to Bloomberg,
http://cocacolabuffet.blogspot.com/search/label/REIT
Disclaimer: This blog is for general information purpose only. Stocks/financial instruments mentioned in this blog are not to be taken as investment advice/recommendation. Readers must consult their own financial advisors and/or consider their own risk/reward profile before making investment/trading decisions. The blog author is not liable for any investment/trading decisions of readers should readers decide to base the decisions on information provided by the blog.
Disclosure: The blog author owns DDR in her personal account as of November 17,2009
According to Bloomberg,
DDR's $400 million issue is the first new U.S. commercial mortgage-backed backed security since mid-2008. The $323.5 million AAA-rated portion is expected to sell at a 1.45 to 1.60 percentage point premium to the five-year interest rate swap benchmark, or a yield of about 4.21 percent, IFR reported. Underwriter Goldman Sachs at midday lowered the yield premium from a range of 1.60 to 1.75 points, indicating it was seeing good demand from investors. By comparison, top-rated issues done under relatively conservative underwriting standards in 2004 are selling at premiums in the mid-2 percentage point range, according to Guggenheim Capital Markets.
The deal may signal some relief for the $700 billion commercial mortgage-backed securities market, which became key funding for office, retail and apartment buildings during the real estate boom.You may find related articles in the following:
http://cocacolabuffet.blogspot.com/search/label/REIT
Disclaimer: This blog is for general information purpose only. Stocks/financial instruments mentioned in this blog are not to be taken as investment advice/recommendation. Readers must consult their own financial advisors and/or consider their own risk/reward profile before making investment/trading decisions. The blog author is not liable for any investment/trading decisions of readers should readers decide to base the decisions on information provided by the blog.
Disclosure: The blog author owns DDR in her personal account as of November 17,2009
Monday, November 16, 2009
What they say about the economy today?
Meredith's Bearish on Banks and the Economy
The influential bank analyst, Meredith Whitney who cut her rating on Goldman Sachs Group Inc. last month, said bank stocks are overvalued after rallying faster than the U.S. economy and share prices will fall to tangible book value.
“I haven’t been this bearish in a year,” Whitney, founder of Meredith Whitney Advisory Group LLC, said today in a CNBC television interview. “I think you can sit on cash for a little bit, because you have to wait for a leg down in valuations. The S&P is expensive across the board.”
“The banks that are asset-sensitive to consumer credit are not places you want to be,” Whitney said. Financial companies aren’t adequately capitalized and will need to raise more capital in the next year, she said.
Whitney said she expects a so-called double-dip recession in which the U.S. economy slumps again before recovering. She said bank stocks won’t fall as far as they did last year because of a smaller impact from fair-value accounting, which requires companies to value assets each quarter to reflect market prices.
Ben Bernanke Signals No Intervention in Foreign Exchange
Federal Reserve Chairman Ben S. Bernanke said it’s “not obvious” that asset prices in the U.S. are out of line with underlying values after a 64 percent jump in the Standard & Poor’s 500 Index from its March low.
“It is inherently extraordinarily difficult to know whether an asset’s price is in line with its fundamental value,” he said today in response to audience questions after a speech in New York. “It’s not obvious to me in any case that there’s any large misalignments currently in the U.S. financial system.”
The U.S. central bank chief didn’t address asset prices outside of the country. Financial officials in Japan and China, Asia’s two largest economies, said this week that the Fed’s interest-rate policy risks spurring speculative capital that may inflate asset prices and derail the global economic recovery.
“The best approach here if at all possible is to use supervisory and regulatory methods to restrain undue risk-taking and to make sure the system is resilient in case an asset-price bubble bursts in the future,” Bernanke said.
Bernanke said in his speech that the “headwinds” of reduced bank lending and a weak labor market will probably restrain the pace of the U.S. economic recovery, warranting continued low borrowing costs. Bernanke also said the Fed is “attentive” to changes in the dollar’s value and “will help ensure that the dollar is strong.”
Thursday, November 12, 2009
BDI surging to 4000
Baltic Dry Index (BDI) , a measure of dry bulk shipping spot rate, surged 206 points yesterday , bringing the index to 3954. As we have previously discussed in " Dry Bulk Shipping Ready to Sale? " Iron ore negotiations and China growth are two drivers of the surge. COSCO analyst predicted that BDI would reach 4000 before the end of the year. Today certainly made him look like a genius.
The current index of three types of ships: Capeside, Panamax, Supramax stand at 67385, 30430 and 21129 respectively, significantly higher than the "dark age" a year ago at 4193, 6912, and 5580 respectively. [Click on the diagram to enlarge the view]

The global economic recovery led by emerging markets such as China has definitely lifted the tide but the spot rates are still abysmal compared to its peak in 2008 when Capeside rates could fetch as high as approximately 230,000, a little less than 4 times yesterday's rate. All dry bulk shipping companies, in face of adverse and precipitous economic meltdown, dashed to raise fund by issuing new shares to avert bankruptcy. Most of the companies had their equity diluted to such an extent that the level of spot rate that yielded jaw-dropping profits in the past will have to go a much longer way in producing the same results.
Another dark cloud that has been overshadowing the industry is the potential huge glut of new ships coming online by 2011.
According to N Cotzias Shipping, the capsize market at the end of September consists of 825 ships of a total of 149 million tonnes carrying capacity. The average age of fleet is 10.6 years.Based on its latest monthly report, N Cotzias said that just 16 capes of 2.8 million tonnes DWT have been scrapped. At the same time, the projected contracted and already under construction vessels that will enter the market until 2016 are 736 units of a total 144 million DWT. Out of these new buildings 429 units, or 80 million DWT are to enter the market by the end of 2010. Until today we only have 25 new buildings capes cancelled of which 9 were to be delivered in 2009 and 12 in 2010.This is a mere 5% only of the total of new ship orders.
Based on this assumption, Cotzias said that that "If we scrap only 2% of the total active fleet and if we cancel only 5% of the total orders, we are mathematically driven to expect that the Capsize market is head on to be over capacitated by 90% to 95% if all current trends prevail during remaining 2009 and 2010."I remain short-term speculatively bullish in this sector due to near term catalysts such as favorable asset market sentiments, especially to commodities, imminent iron ore negotiations and continued growth in China. For longer term, uncertainty surrounding the sustainability and strength of global growth together with the upcoming glut in ships still have not offered attractive reward/risk profile for this industry.
Tuesday, November 10, 2009
How many Kindle will be sold?
Since the e-commerce giant, Amazon (AMZN) released its earnings on October 22, 2009, I have been debating with myself whether I should write something about it. Most of my reluctance comes from my inherent resistance to high-tech toys. I have to say I have a good nose for almost everything in fashion except for these gadgets which I dismiss as a guy thing which I , you know, don't wanna barge into. However, I have to admit that Kindle did leave an impression on me at a Xmas party last year when the host's wife proudly showed all female guests her favorite Xmas gift, Kindle. Staring into Kindle held in her hand, the screen itself could easily pass as a "book" to me rather than "a guy thing". Between the Xmas songs, the Xmas tree, the warm blistful crowd, it even appeared to be "friendly" to me.
This "not-a-guy-thing” has caught a spotlight after almost a year. It has become the top selling products on Amazon, not just in the category of electronics but across the board.
The other part of my reluctance to write about it is the likelihood that I am late on board. Spending too much time on a short-lived hype is definitely not my style. After some thinking and research, it strikes me that this may be revolutionary rather than just a hype. So, maybe late, but not too late.
Because Amazon refused to reveal the sales number of Kindle, we can only rely on analysts' estimate for the moment. According to Techflash,
Citigroup's Mark Mahaney now believes that Amazon will sell 1.5 million Kindles this year -- 500,000 higher than his previous estimate. Likewise, he's saying Kindle revenue could jump to $700 million from $550 million.
Mahaney writes in a research note that Amazon's Kindle price cut -- from $299 to $259 -- is "typical" of the ecommerce giant, coming "prior to the market having a viable competitor." He said the price cut "sets up the Kindle for a full runway for Q4" and increases the reader's chances of becoming "one of the hit products of the holiday season."
He estimates that Kindle will sell 2.7 million units and do $1.5 billion in revenue in 2010, roughly 5 percent of Amazon's total revenue. Amazon hasn't revealed any numbers on Kindle sales -- and CEO Jeff Bezos has suggested the company may never give up that information -- so a lot of this is reading tea leaves.
Amazon's big competition in the e-reader market, Sony, is ramping up its advertising ahead of the holiday season. And there's a bunch of other companies are making plans to jump into the fray, including Irex, Asus, and Plastic Logic.
Forrester Research today boosted its projection for total e-reader sales, saying they'll now reach 3 million units in 2009, with 30 percent of sales occurring during the November-December holiday shopping season. That's up 50 percent from Forrester's previous projection of 2 million units in 2009. The research firm said further that e-reader sales could reach beyond 6 million in 2010.
Has Risk Aversion Returned?
It is common that in the early stage of economic or stock market recovery, small cap stocks outperform large cap stocks. We have seen that in the last 8 months until recently. In the most recent pullback, small caps were beaten so hard that many had stock prices go back to the pre-summer level. Small caps have not claimed the lost ground despite very strong rally of major indices since last Wednesday. Has risk aversion returned and we are in danger of a significant correction? Or small caps will catch up soon?


Monday, November 9, 2009
DGW-China Water Play
As risk aversion among investors subsides, growth stocks may be in fashion. Duoyuan Global Water Inc. (DGW) could be one of the niche plays amidst increased government spending and regulations on the standard of water in China.
The company reported a earnings result that epitomizes a growth company for the third quarter 2009
As a strategic plan, I would expect the company to acquire smaller companies to consolidate long-term growth. The company has cash and bank deposits of RMB937.2 million ($137.3 million), compared to RMB198.5 million as of December 31, 2008, mostly reflecting net proceeds from the Company's initial public offering.
Until the company gains reasonably larger market share, I would view this as a tactical speculative play that works well in a market that is less risk averse rather than a long-term growth value play.
You may also be interested in the following articles:
http://cocacolabuffet.blogspot.com/2009/10/tap-into-chinese-water.html
http://cocacolabuffet.blogspot.com/2009/10/no-drought-for-trit.html
Disclaimer: This blog is for general information purpose only. Stocks/financial instruments mentioned in this blog are not to be taken as investment advice/recommendation. Readers must consult their own financial advisors and/or consider their own risk/reward profile before making investment/trading decisions. The blog author is not liable for any investment/trading decisions of readers should readers decide to base the decisions on information provided by the blog.
Disclosure: The blog author does not have positions of DGW as of November 9, 2009
The company reported a earnings result that epitomizes a growth company for the third quarter 2009
- Revenue increased 30.9% to RMB255.2 million ($37.4 million) from RMB195.0 million in the prior year period.
- Gross margin increased to 49.5% from 46.8% in the prior year period.
- Operating income increased 31.1% to RMB95.7 million ($14.0 million) from RMB73.0 million in the prior year period.
- Net income increased 23.1% to RMB73.4 million ($10.8 million) from RMB59.6 million in the comparable period of 2008.
- Diluted earnings per ADS was $0.49. Each ADS represents two of the Company's ordinary shares.
- Revenue from wastewater treatment equipment increased 42.3%, to RMB100.1 million ($14.7 million) in the third quarter of 2009 compared to RMB70.3 million in the third quarter of 2008, due to increased demand for Duoyuan's belt filter press machines, sludge screw, online testing equipment, ultraviolet shelving disinfection systems and microporous aerators.
- Revenue from circulating water treatment increased by 20.0% to RMB96.1 million ($14.1 million) in the third quarter of 2009 compared to RMB80.1 million in the third quarter of 2008, driven by increased demand for the Company's new fully automatic filters, electronic water conditioners and circulating water central processors.
- Revenue from water purification equipment increased by 28.4% to RMB55.0 million ($8.1 million) in the third quarter of 2009 compared to RMB42.8 million in the prior year period, as the Company's newly introduced models for central water purifiers, industry pure water equipment and ultraviolet water purifiers continued to be well-received by the marketplace.
As a strategic plan, I would expect the company to acquire smaller companies to consolidate long-term growth. The company has cash and bank deposits of RMB937.2 million ($137.3 million), compared to RMB198.5 million as of December 31, 2008, mostly reflecting net proceeds from the Company's initial public offering.
Until the company gains reasonably larger market share, I would view this as a tactical speculative play that works well in a market that is less risk averse rather than a long-term growth value play.
You may also be interested in the following articles:
http://cocacolabuffet.blogspot.com/2009/10/tap-into-chinese-water.html
http://cocacolabuffet.blogspot.com/2009/10/no-drought-for-trit.html
Disclaimer: This blog is for general information purpose only. Stocks/financial instruments mentioned in this blog are not to be taken as investment advice/recommendation. Readers must consult their own financial advisors and/or consider their own risk/reward profile before making investment/trading decisions. The blog author is not liable for any investment/trading decisions of readers should readers decide to base the decisions on information provided by the blog.
Disclosure: The blog author does not have positions of DGW as of November 9, 2009
Friday, November 6, 2009
10.2% Unemployment!! Now What?
The Bureau Labor of Statistics (BLS) announced today that the unemployment rate increased from 9.8% in September to 10.2%, the highest since 1983. 190,000 non-farm jobs were lost. 8.2 million people lost their job since December 2007, the beginning of the economic meltdown. In October, the number of unemployed persons increased by 558,000 to 15.7 million.
On a normal day, one would have taken this as a disastrous number. After all, 10% was thought of a psychological level just like Dow Index 10,000. But, nothing, nada!
The news received fairly silent treatment from the market as the market wanders around a very narrow range for the most part of the trading day (It's 2.34pm EST now). With a number like this and there is no triple digit sell-off, not even a double digit sell-off, not even a knee-jerk reaction, there is only one obvious reason: People are not panicky. People saw it coming and people believed this was as bad as it could get.
On the hind sight, it probably should not be a surprise after all. The survey of 52 economists by Wall Street Journal in September reported that most economists still expected the unemployment rate would climb to 10.2%, from September's 9.7% , before falling early next year. These economists also in general expected jobs being added in the next 12 months although they expected only 200,000 jobs will be added. They expected the unemployment rate to stay as high as 9.3% in December 2010.
This is quite consistent with the Fed's forecast in September FOMC minutes. The Fed expected the unemployment rate to stay around 9.4% in 2010 and come down to 8% only in 2011.
So, now we know people did see it coming and it should not come as a surprise that the unemployment rate will stay high for quite a while (which is typical of recessions in 1990s and 2000s). The next question we have to get ahead is: Is 10.2% as bad as it can get?
Related posts:
http://cocacolabuffet.blogspot.com/2009/11/how-much-longer-can-productivity-be.html
Thursday, November 5, 2009
How Much Longer Can Productivity Be Squeezed?
The Bureau of Labor Statistics (BLS) reported a stunning 9.5% jump of productivity in the third quarter. Productivity , simply put, is output per labor hour. With unemployment rate expected to top 10% soon, workers who still have jobs are beeing squeezed to get the job done. How much longer can companies go without hiring by simply squeezing every bit out of productivity?
Although history does not always repeat in the same manner, it may be fun to do a little bit of pre-weekend economics homework by looking into the past. I looked at the economic downturn in the last 40 years. The economic downturn refers to the peak to trough of the US economy as marked by National Bureau of Economic Research (NBER).
The first date marked the peak of a business cycle while the second date marked the trough (the end of the downturn) and the number in parenthesis marked the quarter.
1. December 1969(IV) --November 1970 (IV)
Productivity peaked 1 quarter after the end of downturn. Unemployment peaked 1 month after the end of downturn.
2.November 1973(IV)-- March 1975 (I)
Productivity peaked 1 quarter after the downturn ended. Unemployment peaked 1 month after the end of the downturn
3. January 1980(I)-- July 1980 (III)
Productivity peaked 2 quarters after the downturn ended. Unemployment peaked in the very same month the downturn ended.
4. July 1981(III) --November 1982 (IV)
Productivity peaked 2 quarters after the downturn ended. Unemployment peaked 1 month after the downturn ended
5. July 1990(III)-- March 1991(I)
Productivity peaked 4 quarters after the downturn ended while unemployment 15 months after the downturn ended
6. March 2001(I)-- November 2001 (IV)
Productivity peaked 7 quarter later although there was a significant spike 1 quarter after the downturn ended.Unemployment peaked 17 months after the end of downturn
7. December 2007(IV) -- ???
By a very quick look at these numbers, one may notice a difference between the periods in 1970s,80s and the periods in 1990s,2000s. During downturns in 1970s,1980s, productivity and unemployment peaked soon after the end of the downturn (within a quarter or two for productivity and a month or two for unemployment). In contrast, productivity and unemployment peaked long after the end of downturns was marked in 1990s and 2000s (as long as 5 quarters and/or 17 months).
What contributed to such a long lag between the bottom of the downturn and the peak of productivity and unemployment? A wild guess of mine would be technology and outsourcing. Technology nowadays enables a company to go by just fine without many in-house supporting services such as accounting, human resources, customer services. These tasks can all be outsourced in order to save cost. I suspect this will also be the case for this downturn. Productivity and unemployment rates can stay high long after the trough has been reached.
Ok, now. The next question is: Have we reached the trough yet?
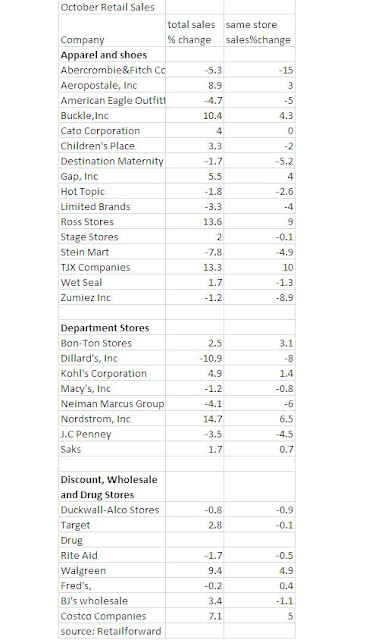
Retailer October Round-Up
It's that time of the month again when retailers reported their monthly sales. The industry reported October same store sales growth of 1.8%, slightly below analysts' estimates of 2.0% according to Thompson Reuters.
In general, almost all sub-sectors of retailers posted some sales gains from September except for teenage apparel and departmental stores. The following is a snapshot of the % change of same-store sales, an important metric of retailers' performance and the % of total sales [Click on the diagram to enlarge the view].
In general, almost all sub-sectors of retailers posted some sales gains from September except for teenage apparel and departmental stores. The following is a snapshot of the % change of same-store sales, an important metric of retailers' performance and the % of total sales [Click on the diagram to enlarge the view].

Wednesday, November 4, 2009
The Fed maintains a sweet spot
From FOMC Statement
On the real economy:
With substantial resource slack likely to continue to dampen cost pressures and with longer-term inflation expectations stable, the Committee expects that inflation will remain subdued for some time.
Monetary policies:
The Committee will maintain the target range for the federal funds rate at 0 to 1/4 percent and continues to anticipate that economic conditions, including low rates of resource utilization, subdued inflation trends, and stable inflation expectations, are likely to warrant exceptionally low levels of the federal funds rate for an extended period.
To provide support to mortgage lending and housing markets and to improve overall conditions in private credit markets, the Federal Reserve will purchase a total of $1.25 trillion of agency mortgage-backed securities and about $175 billion of agency debt. The amount of agency debt purchases, while somewhat less than the previously announced maximum of $200 billion, is consistent with the recent path of purchases and reflects the limited availability of agency debt. In order to promote a smooth transition in markets, the Committee will gradually slow the pace of its purchases of both agency debt and agency mortgage-backed securities and anticipates that these transactions will be executed by the end of the first quarter of 2010.
Off the top of my head
The economy is in the "sweet spot" for the next 3 to 6 months-- economic activities continue to improve while monetary policies continue to be very accomodating. Cheap money is always welcomed. Stock market and bond market should be able to benefit from liquidity and subdued inflation and inflation expectations. New highs can be made. Low interest rates should continue to lead to weak US dollar. In the immediate short term, however, I would be cautious about 3-5% pullbacks of the stock market (e.g.Dow getting to aroung 9650) as substantial resource slack may shake confidence easily after an extended rally.
On the real economy:
- Economic activity has continued to pick up.
- Conditions in financial markets were roughly unchanged.
- Activity in the housing sector has increased over recent months.
- Household spending appears to be expanding but remains constrained by ongoing job losses, sluggish income growth, lower housing wealth, and tight credit.
- Businesses are still cutting back on fixed investment and staffing, though at a slower pace
- Businesses continue to make progress in bringing inventory stocks into better alignment with sales.
With substantial resource slack likely to continue to dampen cost pressures and with longer-term inflation expectations stable, the Committee expects that inflation will remain subdued for some time.
Monetary policies:
The Committee will maintain the target range for the federal funds rate at 0 to 1/4 percent and continues to anticipate that economic conditions, including low rates of resource utilization, subdued inflation trends, and stable inflation expectations, are likely to warrant exceptionally low levels of the federal funds rate for an extended period.
To provide support to mortgage lending and housing markets and to improve overall conditions in private credit markets, the Federal Reserve will purchase a total of $1.25 trillion of agency mortgage-backed securities and about $175 billion of agency debt. The amount of agency debt purchases, while somewhat less than the previously announced maximum of $200 billion, is consistent with the recent path of purchases and reflects the limited availability of agency debt. In order to promote a smooth transition in markets, the Committee will gradually slow the pace of its purchases of both agency debt and agency mortgage-backed securities and anticipates that these transactions will be executed by the end of the first quarter of 2010.
Off the top of my head
The economy is in the "sweet spot" for the next 3 to 6 months-- economic activities continue to improve while monetary policies continue to be very accomodating. Cheap money is always welcomed. Stock market and bond market should be able to benefit from liquidity and subdued inflation and inflation expectations. New highs can be made. Low interest rates should continue to lead to weak US dollar. In the immediate short term, however, I would be cautious about 3-5% pullbacks of the stock market (e.g.Dow getting to aroung 9650) as substantial resource slack may shake confidence easily after an extended rally.
Tuesday, November 3, 2009
The Auto Industry Post Cash-and-Clunker
After a dismal September figure immediately after the end of "Cash-and-Clunker" , many cast doubt on the sustainability of the encouraging signs of stability in the industry without incentives such as "Cash-and-Clunker". October sales soothed the anxious nerves.
October sales were unchanged at 838,000 from the same period last year but up 12% from Sept.The October annualized figure rose to 10.5 million after slumping to 9.2 million in September although it was still far short of the 17 million annual rates from the late 1990s and early 2000s.
From Yahoo Finance ,
"It's ... a fairly stable kind of footing that the industry is getting under it," said Gary Dilts, a former Chrysler sales executive who is now senior vice president of global automotive operations for J.D. Power and Associates.
"Clearly we're seeing improvement in the economy and in the industry. It isn't huge, but it's a good sign given that Cash for Clunkers is over," said Mike DiGiovanni, General Motors Co.'s executive director of global market and industry analysis.
The biggest winner among major automakers was South Korea's Hyundai Motor Co., which saw sales skyrocket 49 percent to 31,005 vehicles, boosted by the Elantra small sedan. Japan's Nissan Motor Co. came next with a 5.6 percent gain, followed by GM at 4.7 percent, aided by strong pickup truck sales, the performance of new models and the highest incentives in the industry. It was GM's first year-over-year monthly sales increase in 21 months.
Toyota Motor Corp. said its sales edged up less than a percent, while Honda sales were flat. Less-rosy news came from Chrysler Group LLC, whose sales fell 30 percent, though they improved from September.
Ford Motor Co.'s sales rose 3 percent and it gained U.S. market share for the 12th time in 13 months as its critically acclaimed vehicles continue to grab buyers from rivals. Ford has benefited from consumer goodwill because it didn't take government bailout money or go into bankruptcy protection, as General Motors and Chrysler did.
Emily Kolinski Morris, Ford's top economist, said uncertainty will continue as long as employment keeps declining, but she said October sales show a real underlying demand for new vehicles after the distorting effects of the clunkers program during July and August. The economy, Kolinski Morris said, is in transition from recession to recovery with financial markets improving.
And the auto industry still has to see its way through a number of economic challenges, said Bob Carter, a Toyota vice president. "We expect the recovery to be very gradual, extending into next year and beyond," he said.
GM was obviously concerned about its incentive spending, with new sales chief Susan Docherty saying that the company had to bring the numbers down. GM spent $4,100 per vehicle last month as it paid to phase out the Saturn and Pontiac brands. It also had to unload a large number of 2009 pickup trucks.
In October, 52 percent of GM's sales were 2009 models, 47 percent were new 2010s and one percent were from 2008. By contrast, 80 percent of Ford's sales were 2010 models.
GM, Docherty said, plans to reduce incentives as it sells down older models and ships more newly launched vehicles.
Despite GM's spending, industrywide incentives were down about $100 per vehicle compared to September, said Jesse Toprak, chief analyst for the car-pricing Web site TrueCar.com.
He expects incentives will continue to drop in November before rising again at the holidays in December.
He also said that as GM winds down Pontiac and Saturn, eliminating the need for incentives on those vehicles, he expects GM and other automakers to start pricing cars closer to what they'll sell for instead of relying so heavily on incentives.
"Eventually, the product has to sell itself," he said.
Monday, November 2, 2009
Simon: Ready to Shop?
Simon (SPG), the largest U.S. real estate investment trust (REIT) that developed and operated shopping centers shed some lights on better retail atmosphere toward the end of this year.
Sales Per Square Foot
Occupancy in all of the four platforms was up sequentially from 6/30/09, Mills was up a 150 basis points and Regional Mall and Premium Outlet Centers increased 50 basis point and Community, Center, Lifestyle platforms increased 40 basis points.
Regional Mall retail sales in the third quarter were $430. The decline in sales for September over September was much lower than any month year-to-date. Mall leasing spreads were $4.04 for the first nine months of 2009, average base rent was at 9/30/09 was $40.05, up 2% for the year earlier period.
Premium Outlet comparable sales were relatively stable in the third quarter at $492 per square foot, down only $1 from 6/30/09, and actually were up in September on a comparable sales per square foot. Premium outlet releasing spread continues to be strong at $9.25 per square foot for the first nine months of ‘09. Average base rent for the outlets at 9/30/09 was $32.95 per square foot up from the year earlier period.
My Takes
SPG's remark on retailers was consistent with most of the "stabilizing" and "getting better" pictures. However, the multi-billion question at this stage is: How much better?
The people that we’ve been talking to, their inventories are down anywhere from 15% to 22% from last year. So while that is not going to drive top line sales, they are much more optimistic because they have less inventory they have to push out the door, they’re going to be able to be much more disciplined on their pricing and drive a lot more margin improvement and most importantly, cash flow.
......based on talking to the retailers, which David and I are doing a whole lot of everyday that they’re feeling better and we have absolutely seen several instances of retailers that were in here in the second quarter asking for rent relief and modifications and then came back in the third quarter and said, “Looks like, we’re okay.” We don’t need anything. We’re going to make it.
“as I read all of the retail analysts and all of their ratings and their movements virtually all of the retailers are getting upgrades and more positive outlooks based on the expectation that there’s going to be a more profitable Christmas, which may or may not be related to more sales.”
Retailers have started to gain their footing and certain retailers are growing store counts including Aeropostale, Gachi, Apple, the Buckle, California Pizza Kitchen, Fresh, Forever 21, H&M, Michael Kors and Red Robin, to name a few. In a number of predominantly outlet ,tenants are also increasing their store counts. We have a significant amount of leasing volume in our pipeline over 500 deals and 8 million square feet of leases in process across all of our domestic platforms.
In particular, it is good to note the volume of big box activity has significantly increased in the second half of the year. Since mid July we have completed 20 big box deals across the four platforms and discussions are underway on 20 to 30 more retailers will include Forever 21, H&M Dave & Buster’s, Bed Bath & Beyond. We are seeing a slight quality of the big box retailers they want to be in malls, outlets, mills or strip centers where they benefit from shopper quality and traffic.
Preliminary reports from retailers regarding October have been encouraging. We believe our retailers will have a decent holiday season.
Sales Per Square Foot
Occupancy in all of the four platforms was up sequentially from 6/30/09, Mills was up a 150 basis points and Regional Mall and Premium Outlet Centers increased 50 basis point and Community, Center, Lifestyle platforms increased 40 basis points.
Regional Mall retail sales in the third quarter were $430. The decline in sales for September over September was much lower than any month year-to-date. Mall leasing spreads were $4.04 for the first nine months of 2009, average base rent was at 9/30/09 was $40.05, up 2% for the year earlier period.
Premium Outlet comparable sales were relatively stable in the third quarter at $492 per square foot, down only $1 from 6/30/09, and actually were up in September on a comparable sales per square foot. Premium outlet releasing spread continues to be strong at $9.25 per square foot for the first nine months of ‘09. Average base rent for the outlets at 9/30/09 was $32.95 per square foot up from the year earlier period.
My Takes
SPG's remark on retailers was consistent with most of the "stabilizing" and "getting better" pictures. However, the multi-billion question at this stage is: How much better?
ISM continued the expansion
"The manufacturing sector grew for the third consecutive month in October, and the rate of growth is the highest since April 2006 when the PMI registered 56 percent. The jump in the index was driven by production and employment, with both registering significant gains. Production appears to be benefiting from the continuing strength in new orders, while the improvement in employment is due to some callbacks and opportunities for temporary workers. Overall, it appears that inventories are balanced and that manufacturing is in a sustainable recovery mode," said Norbert Ore, the chair of the Institute for Supply Management™ Manufacturing Business Survey Committee.
WHAT RESPONDENTS ARE SAYING ...
"We are beginning to be affected greatly by lead-time increases on semiconductor components." (Computer & Electronic Products)
"Still a very difficult environment — commodity increases threaten recovery and don't seem to correlate with any supply/demand fundamentals." (Food, Beverage & Tobacco Products)
"Automotive demand still remains strong even after 'cash for clunkers.'" (Fabricated Metal Products) [indicated for the second month]
"After several rather busy months, we are seeing the order intake for early next year soften." (Transportation Equipment)
"The improvement seen earlier is not holding." (Primary Metals)BREAKING DOWN THE INDEX
PMI
The recovery in manufacturing strengthened in October as the PMI registered 55.7 percent, which is 3.1 percentage points higher than the 52.6 percent reported in September, and the highest reading for the index since April 2006 (56 percent). A reading above 50 percent indicates that the manufacturing economy is generally expanding; below 50 percent indicates that it is generally contracting.
A PMI in excess of 41.2 percent, over a period of time, generally indicates an expansion of the overall economy. Therefore, the PMI indicates growth for the sixth consecutive month in the overall economy, as well as expansion in the manufacturing sector for the third consecutive month.
New Orders
ISM's New Orders Index registered 58.5 percent in October, 2.3 percentage points lower than the 60.8 percent registered in September. This is the fourth consecutive month of growth in the New Orders Index. A New Orders Index above 48.8 percent, over time, is generally consistent with an increase in the Census Bureau's series on manufacturing orders (in constant 2000 dollars).
Production
ISM's Production Index registered 63.3 percent in October, which is an increase of 7.6 percentage points from the September reading of 55.7 percent. An index above 50.4 percent, over time, is generally consistent with an increase in the Federal Reserve Board's Industrial Production figures. This is the fifth consecutive month the Production Index has registered above 50 percent.
Employment
ISM's Employment Index registered 53.1 percent in October, which is 6.9 percentage points higher than the 46.2 percent reported in September. This is the first month of growth in manufacturing employment following 14 consecutive months of decline. An Employment Index above 49.7 percent, over time, is generally consistent with an increase in the Bureau of Labor Statistics (BLS) data on manufacturing employment
Supplier Deliveries
The delivery performance of suppliers to manufacturing organizations was slower in October as the Supplier Deliveries Index registered 56.9 percent, which is 1.1 percentage points lower than the 58 percent registered in September. This is the fifth consecutive month the Supplier Deliveries Index has been above 50 percent, following eight months of faster delivery performance. A reading above 50 percent indicates slower deliveries.
Inventories
Manufacturers' inventories contracted at a slower rate in October as the Inventories Index registered 46.9 percent. The index is 4.4 percentage points higher than the September reading of 42.5 percent. An Inventories Index greater than 42.6 percent, over time, is generally consistent with expansion in the Bureau of Economic Analysis' (BEA) figures on overall manufacturing inventories (in chained 2000 dollars).
Customers' Inventories
The ISM Customers' Inventories Index registered 38.5 percent in October, slightly lower than in September when the index registered 39 percent. The index indicates that respondents believe their customers' inventories are too low at this time. This is the seventh consecutive month the Customers' Inventories Index has been below 50 percent, following eight months above 50 percent.
Prices
The ISM Prices Index registered 65 percent in October, 1.5 percentage points higher than the 63.5 percent reported in September. This is the fourth consecutive month that the Prices Index has registered above 50 percent. While 37 percent of respondents reported paying higher prices and 7 percent reported paying lower prices, 56 percent of supply executives reported paying the same prices as in September. A Prices Index above 47.6 percent, over time, is generally consistent with an increase in the Bureau of Labor Statistics (BLS) Index of Manufacturers Prices.
Backlog of Orders
ISM's Backlog of Orders Index registered 53.5 percent in October, the same as reported in September. Of the 81 percent of respondents who reported their backlog of orders, 27 percent reported greater backlogs, 20 percent reported smaller backlogs, and 53 percent reported no change from September.
New Export Orders
ISM's New Export Orders Index registered 55.5 percent in October, 0.5 percentage point higher than the 55 percent reported in September. This is the fourth consecutive month of growth in the New Export Orders Index, following nine consecutive months of contraction.
Imports
Imports of materials by manufacturers expanded in October as the Imports Index registered 51 percent, 1 percentage point lower than the 52 percent reported in September. Imports have contracted in 18 of the last 21 months.
Buying Policy
Average commitment lead time for Capital Expenditures increased 4 days to 103 days. Average lead time for Production Materials decreased 5 days to 41 days. Average lead time for Maintenance, Repair and Operating (MRO) Supplies decreased 2 days to 21 days.
Subscribe to:
Posts (Atom)