Showing posts with label Market View. Show all posts

Thursday, November 4, 2010

Some Statistics on Midterm Election Effects

From the article "Midterm Election Impact on Stock" in huffington.com

Year 2011 is the year before a president faces re-election, the year after a president has lost control of Congress and the second year of a fragile economic expansion.

THE YEAR BEFORE A PRESIDENT RUNS FOR ELECTION: 
Since 1945, the Dow Jones industrial average has gained an average of 19 percent the year before a sitting president runs. That's more than double the 7.9 percent average annual gain during the same period. If you take out the 10 years when the president was running, the average gain drops to only 5.8 percent...................................................
THE YEAR AFTER A PRESIDENT LOSES CONTROL OF CONGRESS

Presidents whose party controlled both houses of Congress have lost at least one chamber five times in the past 80 years. Stock returns in the following year haven't followed a pattern. The Dow plunged 53 percent in 1931 and gained 34 percent in 1995. Gains in the other three years ranged from 2.2 percent to 20.8 percent. That makes it impossible to forecast what will happen this time. The change in Congress in 1931 came during the Great Depression, while the 1995 transition came during the first part of the Internet boom. The next Congress faces a fragile economic period, which could mean that the market offers another single-digit gain like this year.

Gridlock hasn't been great for stocks. Since 1945, the Standard and Poor's 500 index has gained 4 percent in years when Congress was split between parties. It increased 8 percent when Congress was controlled by one party and the White House another. When a single party was in control of Washington, the index gained an average of 11 percent.
SLOW-GROWING ECONOMY
..................................................................................................................
.....................Stocks have been in a bull market for 18 months, pushing the Dow up 70 percent since it hit a 12-year low in March 2009. That gain is larger than normal but isn't surprising considering that the rally followed the worst financial crisis since the Great Depression. During slow recoveries like this one, bull markets typically last 30 months and bring gains of 44 percent overall, according to Ned Davis Research.
According to Clearbridgeadvisors.com,
"......Subsequent to 17 mid-term elections since 1942, the S&P 500 appreciated 17 times (100% batting average) over the next 200 days, with the average return being 18.3%. The low percentage gain (+3.9%) was in 1946, just after World War II ended and deflation fears were in vogue, and more recently the 6.1% gain for the S&P 500 after the 2006 mid-term elections....."
In the same report, MKM Partners and the Leuthold Group both suggest bull market ahead. MKM Partners pointed out that stock valuation are more attraction than bond. The earning yield of companies , which is earnings divided by stock price is 3 percent higher than bond yield, the highest since 1951, the administration of President Truman. The Leuthold Group, by studying the relationship between P/E during the midterm election and the following 10-year stock return, suggests that the 10-year-annualized return following 2010 election will be 11%.

All in all, without digging into the "Why's", descriptive statistics generally lean toward a bull market following this midterm election.

Tuesday, May 25, 2010

How Fearful is the Market?

As the sovereign-debt crisis in Europe develops, market participants are pricing larger scale systemic risks.

Libor and Libor-OIS spread
The dollar Libor-OIS spread, a gauge of banks’ reluctance to lend, widened to the most since July 16. The cost of borrowing in euros for three months climbed to 0.64 percent.Libor has more than doubled this year.

The Libor-OIS spread widened to 31.6 basis points from 28.4 basis points. The spread, which compares three-month dollar Libor and the overnight indexed swap rate, surged to 364 basis points, or 3.64 percentage points, after the collapse of Lehman Brothers Holdings Inc. in September 2008.
 
 
TED spread
Another gauge of fear, the TED spread, the gap between the three-month T-bill interest rate  and three-month Libor jumped to 36.9 basis points, also the highest since July. The TED spread -- -- spiked in October 2008 to more than 460 basis points. Adding to the sign of rising costs for companies to borrow funds is two-year swap spreads that just rose to 58 basis points, the highest since May 2009.
 
VIX
Volatility Index of S&P 500, VIX, now a popular barometer of fear factor, rose to 34.61 today. It reached a peak of 80 in October 2008.


Monday, December 7, 2009

The Danger of Hot Money

Dubai shook the world last week with a potential default. The country, until recently, with $60 billion foreign debt has been the rising star in emerging markets in the recent years. On Wednesday, Dubai said it would ask creditors of state-owned Dubai World and Nakheel, the builder of its palm-shaped islands, for a standstill agreement as a first step toward restructuring billions of dollars of debt. Influential bank analyst Richard Bove said in a note "it does not appear that American banks have any major direct impact from this event."


Dubai’s problem may not have direct impact on the global economy. However, Dubai’s crisis is just a tip of an iceberg of a potential global calamity. Since the eruption of subprime crisis that originated from the United States, historic low interest rates and weak economic recovery in the United States and Japan have led to massive carry trade. Arbitrageurs borrow “cheap money” at very low interest rates from countries like the United States and Japan in search for higher returns in many emerging markets.

China's foreign currency reserves rose $141 billion from July to September alone, up 20 percent from the same period in 2008. The China International Capital Corporation estimates that $50 billion in speculative capital flowed into China in the third quarter. In the meantime, Southeast Asian countries are growing increasingly concerned about strong inflows of hot money that could lead to asset bubbles in the region, says the Asian Development Bank (ADB). Noritaka Akamatsu, senior adviser at ADB’s Office of Regional Economic Integration, said that some regional governments are thinking of limiting capital inflows in the “short-term, liquid side of the market” as they could destabilise financial systems. “Last week, Indonesia’s central bank said that it was “studying” possible limits on foreign ownership of short-term debt but has no plans for controls on capital or the currency. The South Korean government plans to hold talks on what can be done to handle inflows financed with cheap US-dollar loans. Outside Asia, Russian Finance Minister Alexei Kudrin said that he was alarmed by the amount of hot money flooding into Russia and would support 'soft measures' to stop speculators from inflating the value of the stock market.

Hot money is speculative and destabilizing short-term capital flow. Its elusive and abrupt reversal characterized many previous financial crises such as the Asian Currency Crisis in 1997. Should carry trade unwind due to monetary policy tightening of the United States and/or sudden heightened risk aversion among foreign investors, a financial calamity in emerging markets is foreseeable in the absence of preemptive actions to slow down hot money.

Monday, November 16, 2009

What they say about the economy today?

Meredith's Bearish on Banks and the Economy
The influential bank analyst, Meredith Whitney who cut her rating on Goldman Sachs Group Inc. last month, said bank stocks are overvalued after rallying faster than the U.S. economy and share prices will fall to tangible book value.

“I haven’t been this bearish in a year,” Whitney, founder of Meredith Whitney Advisory Group LLC, said today in a CNBC television interview. “I think you can sit on cash for a little bit, because you have to wait for a leg down in valuations. The S&P is expensive across the board.”

“The banks that are asset-sensitive to consumer credit are not places you want to be,” Whitney said. Financial companies aren’t adequately capitalized and will need to raise more capital in the next year, she said.

Whitney said she expects a so-called double-dip recession in which the U.S. economy slumps again before recovering. She said bank stocks won’t fall as far as they did last year because of a smaller impact from fair-value accounting, which requires companies to value assets each quarter to reflect market prices.

Ben Bernanke Signals No Intervention in Foreign Exchange
 Federal Reserve Chairman Ben S. Bernanke said it’s “not obvious” that asset prices in the U.S. are out of line with underlying values after a 64 percent jump in the Standard & Poor’s 500 Index from its March low.


“It is inherently extraordinarily difficult to know whether an asset’s price is in line with its fundamental value,” he said today in response to audience questions after a speech in New York. “It’s not obvious to me in any case that there’s any large misalignments currently in the U.S. financial system.”

The U.S. central bank chief didn’t address asset prices outside of the country. Financial officials in Japan and China, Asia’s two largest economies, said this week that the Fed’s interest-rate policy risks spurring speculative capital that may inflate asset prices and derail the global economic recovery.

“The best approach here if at all possible is to use supervisory and regulatory methods to restrain undue risk-taking and to make sure the system is resilient in case an asset-price bubble bursts in the future,” Bernanke said.

Bernanke said in his speech that the “headwinds” of reduced bank lending and a weak labor market will probably restrain the pace of the U.S. economic recovery, warranting continued low borrowing costs. Bernanke also said the Fed is “attentive” to changes in the dollar’s value and “will help ensure that the dollar is strong.”

Tuesday, November 10, 2009

Has Risk Aversion Returned?

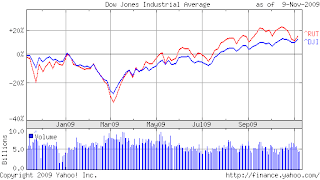
It is common that in the early stage of economic or stock market recovery, small cap stocks outperform large cap stocks. We have seen that in the last 8 months until recently. In the most recent pullback, small caps were beaten so hard that many had stock prices go back to the pre-summer level. Small caps have not claimed the lost ground despite very strong rally of major indices since last Wednesday.  Has risk aversion returned and we are in danger of a significant correction? Or small caps will catch up soon?

1-year and 3-month charts of Dow Jones Industrial Index (that represents large caps) and Russell 2000 (that represents small caps) show this divergence. [Click on diagrams to enlarge the view]